
A Note from Kate
What the Numbers Don’t Tell You About Alameda Real Estate
If you’ve ever looked up your home’s value on Zillow or Redfin, you’ve probably wondered how accurate those numbers really are.
Technology has made an extraordinary amount of real estate information available to the public. You can see what homes are listed for, what they’ve sold for, how long they’ve been on the market, and even how many times a listing has been viewed.
And I think that’s wonderful. I’m a big believer in giving people access to information.
But there’s something I’ve learned over my many years in Alameda real estate: Some of the most valuable information about the market isn’t something you can find online.
It’s knowing which buyers are actively looking for a home like yours. It’s understanding what those buyers are willing to pay, what they’ve already passed on, and what might motivate them to make an offer.
It’s knowing when a property that’s been sitting on the market represents an opportunity rather than a warning sign.
And perhaps most importantly, it’s recognizing that two seemingly similar homes can have entirely different outcomes depending on how they’re positioned, marketed, and negotiated.
That’s what I want to talk about this quarter.
The Story Behind the Sale
One of my favorite examples from Q3 comes from Harbor Bay.
Our team represented the sellers of the two highest-priced homes sold in the neighborhood this quarter.
One went pending in just 12 days.
The other spent 110 days on the market before selling for the second-highest price of the quarter.
Think about that for a moment.
If you were watching those listings online, you might have assumed the home sitting on the market for more than three months was somehow less desirable or that the seller would eventually have to accept a disappointing offer.
But that’s not what happened.
The number of days a home spends on the market doesn’t tell you what it’s worth.
Every home has its own story, and every seller has different priorities. Understanding the property, its competition, the buyer pool, and how to position it effectively is what makes the difference.
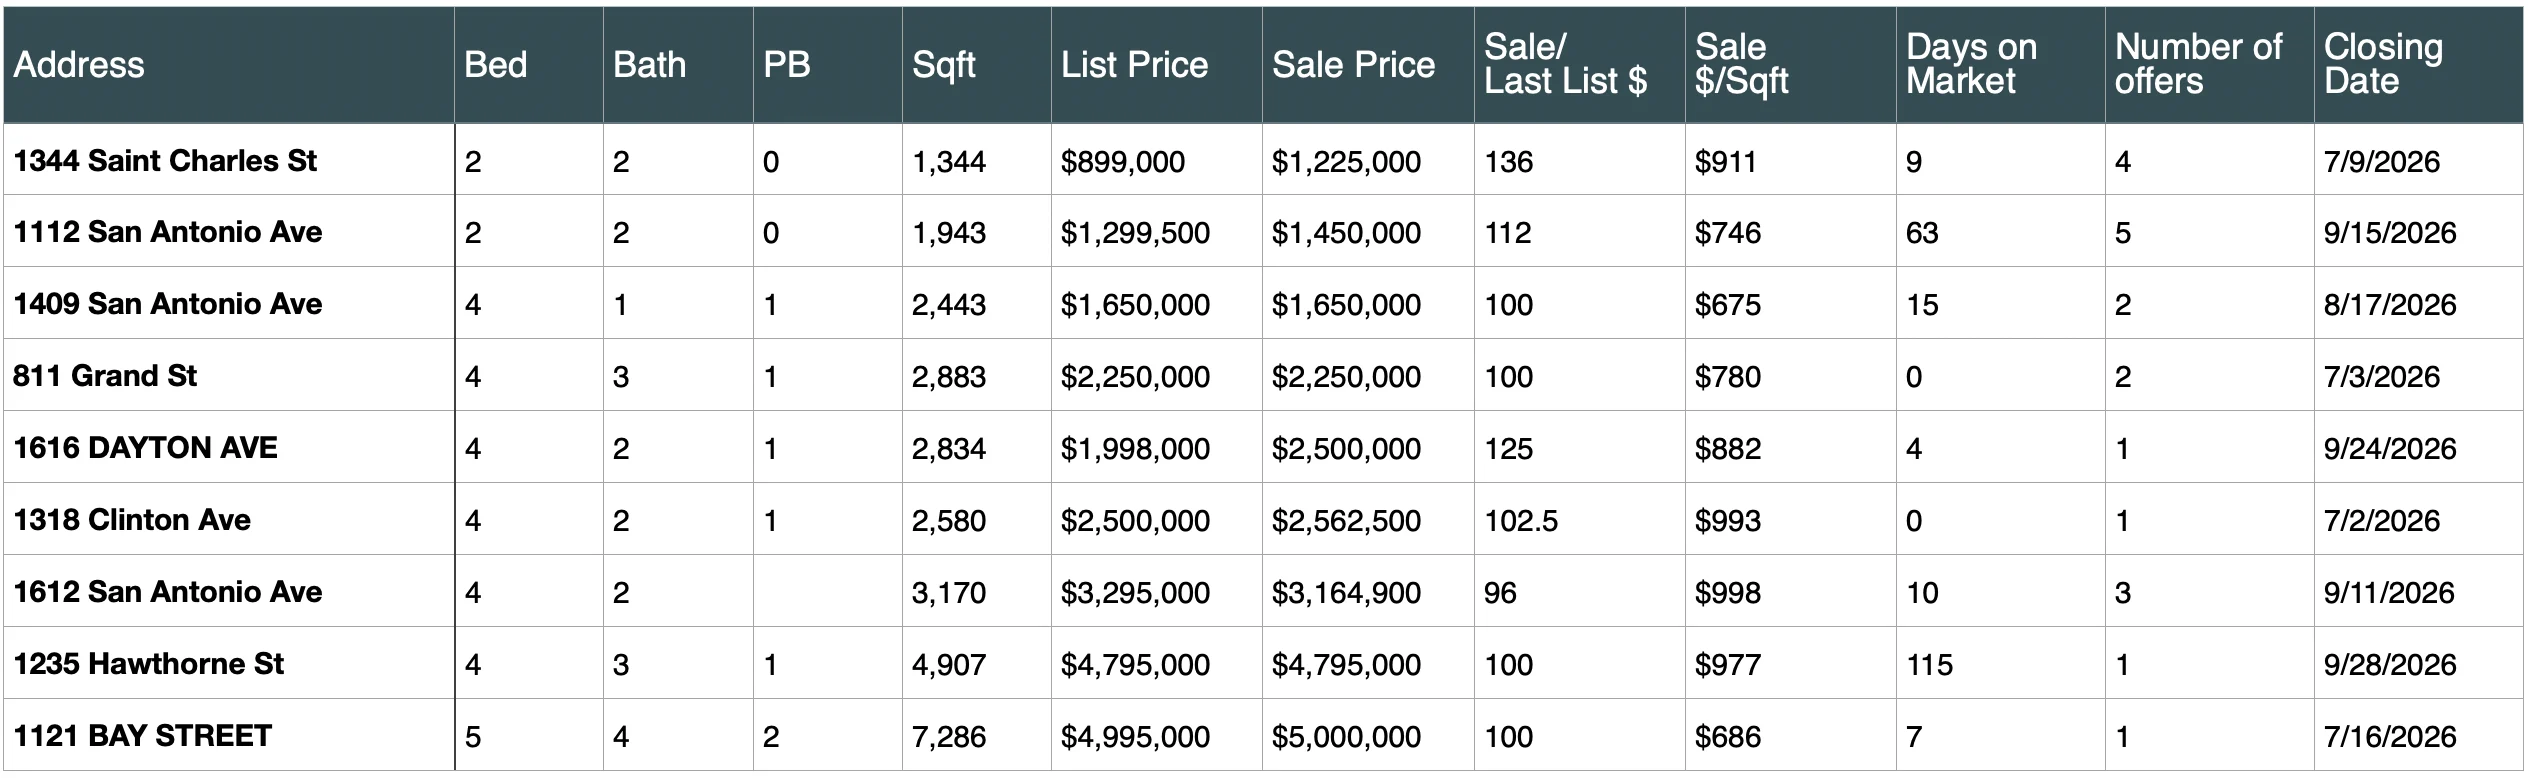
We saw another extraordinary example in the Gold Coast, where Alameda’s highest-ever home sale and our sale of 1235 Hawthorne Street, the third-highest sale in Alameda history, closed just blocks apart.
Those results tell us something important about the depth of demand for exceptional properties in Alameda, but also about the importance of understanding exactly who the likely buyers are.
Which brings me to something I don’t think most homeowners fully appreciate.
The Buyers You Don’t See
When a home goes on the market, everyone focuses on the buyers who make offers.
But what about all the buyers who don’t?
Let’s say we bring a beautiful East End home to market and attract significant interest. Several buyers tour the property. Some make offers. Others love it but ultimately decide it isn’t quite the right fit.
Maybe they wanted another bedroom, a larger backyard, or a different floor plan.
Those buyers don’t simply stop looking for a home.
And at the Kate McCaffrey Group, we don’t forget about them.
Every listing we represent gives us valuable insight into active buyer demand. Through our direct relationships, agent outreach, and buyer follow-up, we’re continuously learning who’s looking, what they want, and where opportunities might exist.
Now imagine you’re considering selling a home that matches what some of those buyers have been searching for.
We may already know people who would be interested in buying it before it ever goes on the market.
That’s a meaningful advantage.
And it’s one of the reasons I believe the number of transactions an agent handles matters beyond simply measuring sales volume.
Each transaction provides another opportunity to develop relationships, understand buyer preferences, and build market intelligence.
Sometimes the Best Opportunities Aren’t Public
We represented sellers in several successful off-market transactions this quarter, including homes in the East End and West End.
I find this especially interesting as we approach the quieter winter months.
Real estate has always been seasonal. Spring tends to be our strongest season, followed by fall, summer, and winter.
I like to think of the slower seasons as periods of distraction.
During the summer, families are busy with vacations, camps, and school schedules. During the holidays, everyone’s attention turns toward Thanksgiving, Christmas, travel, and family gatherings.
That doesn’t mean buyers disappear. It means many have other priorities competing for their attention.
For some sellers, this is an excellent time to explore a private sale rather than immediately entering the public market.
We can identify qualified prospects, reach out to buyers and agents within our network, and see whether there’s an opportunity that makes sense on the seller’s terms.
The seller may be able to remain in the home while exploring options, without accumulating public days on market. And if the right opportunity doesn’t emerge, we can consider a broader public launch when the timing is better.
Private sales aren’t right for every property. Sometimes broad market exposure and competition are exactly what will produce the strongest result. The important thing is understanding your options rather than assuming there’s only one way to sell.
And that’s ultimately what good real estate representation should be about.
Not just knowing what the market is doing, but knowing what to do with that information.
For Buyers: Look Beyond the Asking Price
There’s another opportunity I want buyers to understand as we head toward winter.
When competition slows, sellers sometimes become more willing to consider creative offer terms.
And one of my favorite strategies to explore right now is a 3-2-1 mortgage buydown.
I’m not a lender, so you’ll want to discuss the details and eligibility requirements with a qualified mortgage professional. But I think it’s a fascinating way to approach negotiations.
Here’s how it works.
Imagine you’re buying a $1 million home with 20% down and an $800,000 mortgage at a hypothetical fixed interest rate of 7.5%.
With a 3-2-1 buydown, your payments would temporarily be calculated using lower rates during the first three years.
Year
Payment Rate
Monthly Principal & Interest
Year 1
4.5%
$4,053
Year 2
5.5%
$4,542
Year 3
6.5%
$5,057
Year 4
7.5%
$5,594
That’s approximately $1,541 in monthly payment savings during the first year alone.
A buydown typically requires an upfront subsidy, which can sometimes be negotiated as a seller concession.
The loan’s underlying interest rate doesn’t change, and buyers generally must qualify at the full mortgage rate. But the temporary payment savings can be incredibly helpful during those first few years of homeownership.
And here’s what I love about this approach: instead of simply negotiating a lower purchase price, buyers and sellers have another tool to explore when structuring a deal.
Our marketing team has created a visual calculator that makes it easy to understand how a 3-2-1 buydown works and explore hypothetical savings.
[CLICK HERE TO EXPLORE OUR 3-2-1 BUYDOWN CALCULATOR]
As a subscriber to our quarterly market report, you have access to this resource.
Not every lender or loan program offers this structure, but understanding the available options can help you recognize opportunities that other buyers may overlook.
My Takeaway This Quarter
One of the questions people ask me most often is, “Is now a good time to buy or sell?”
And after all these years, I’ve come to believe there’s no single perfect answer.
In the Bay Area, opportunities often exist in moments.
A home that hasn’t attracted the right buyer yet. A seller who’s willing to consider creative terms. A property that never makes it onto the public market. Or a buyer who’s ready to act when everyone else is distracted.
There isn’t going to be a giant billboard telling you when the perfect time to buy or sell has arrived.
You have to recognize the opportunity.
And that’s why I believe access to information is only half the equation. It’s the experience, relationships, and judgment to know what to do with that information that truly matters.
As we move into the final months of 2026, I encourage you to stay curious, keep an open mind, and remember that the best real estate decisions aren’t always the most obvious ones.
Now, let’s take a closer look at what happened across Alameda during the third quarter.
Alameda Q3 2026 Neighborhood Market Reports
Alameda Neighborhoods
East End
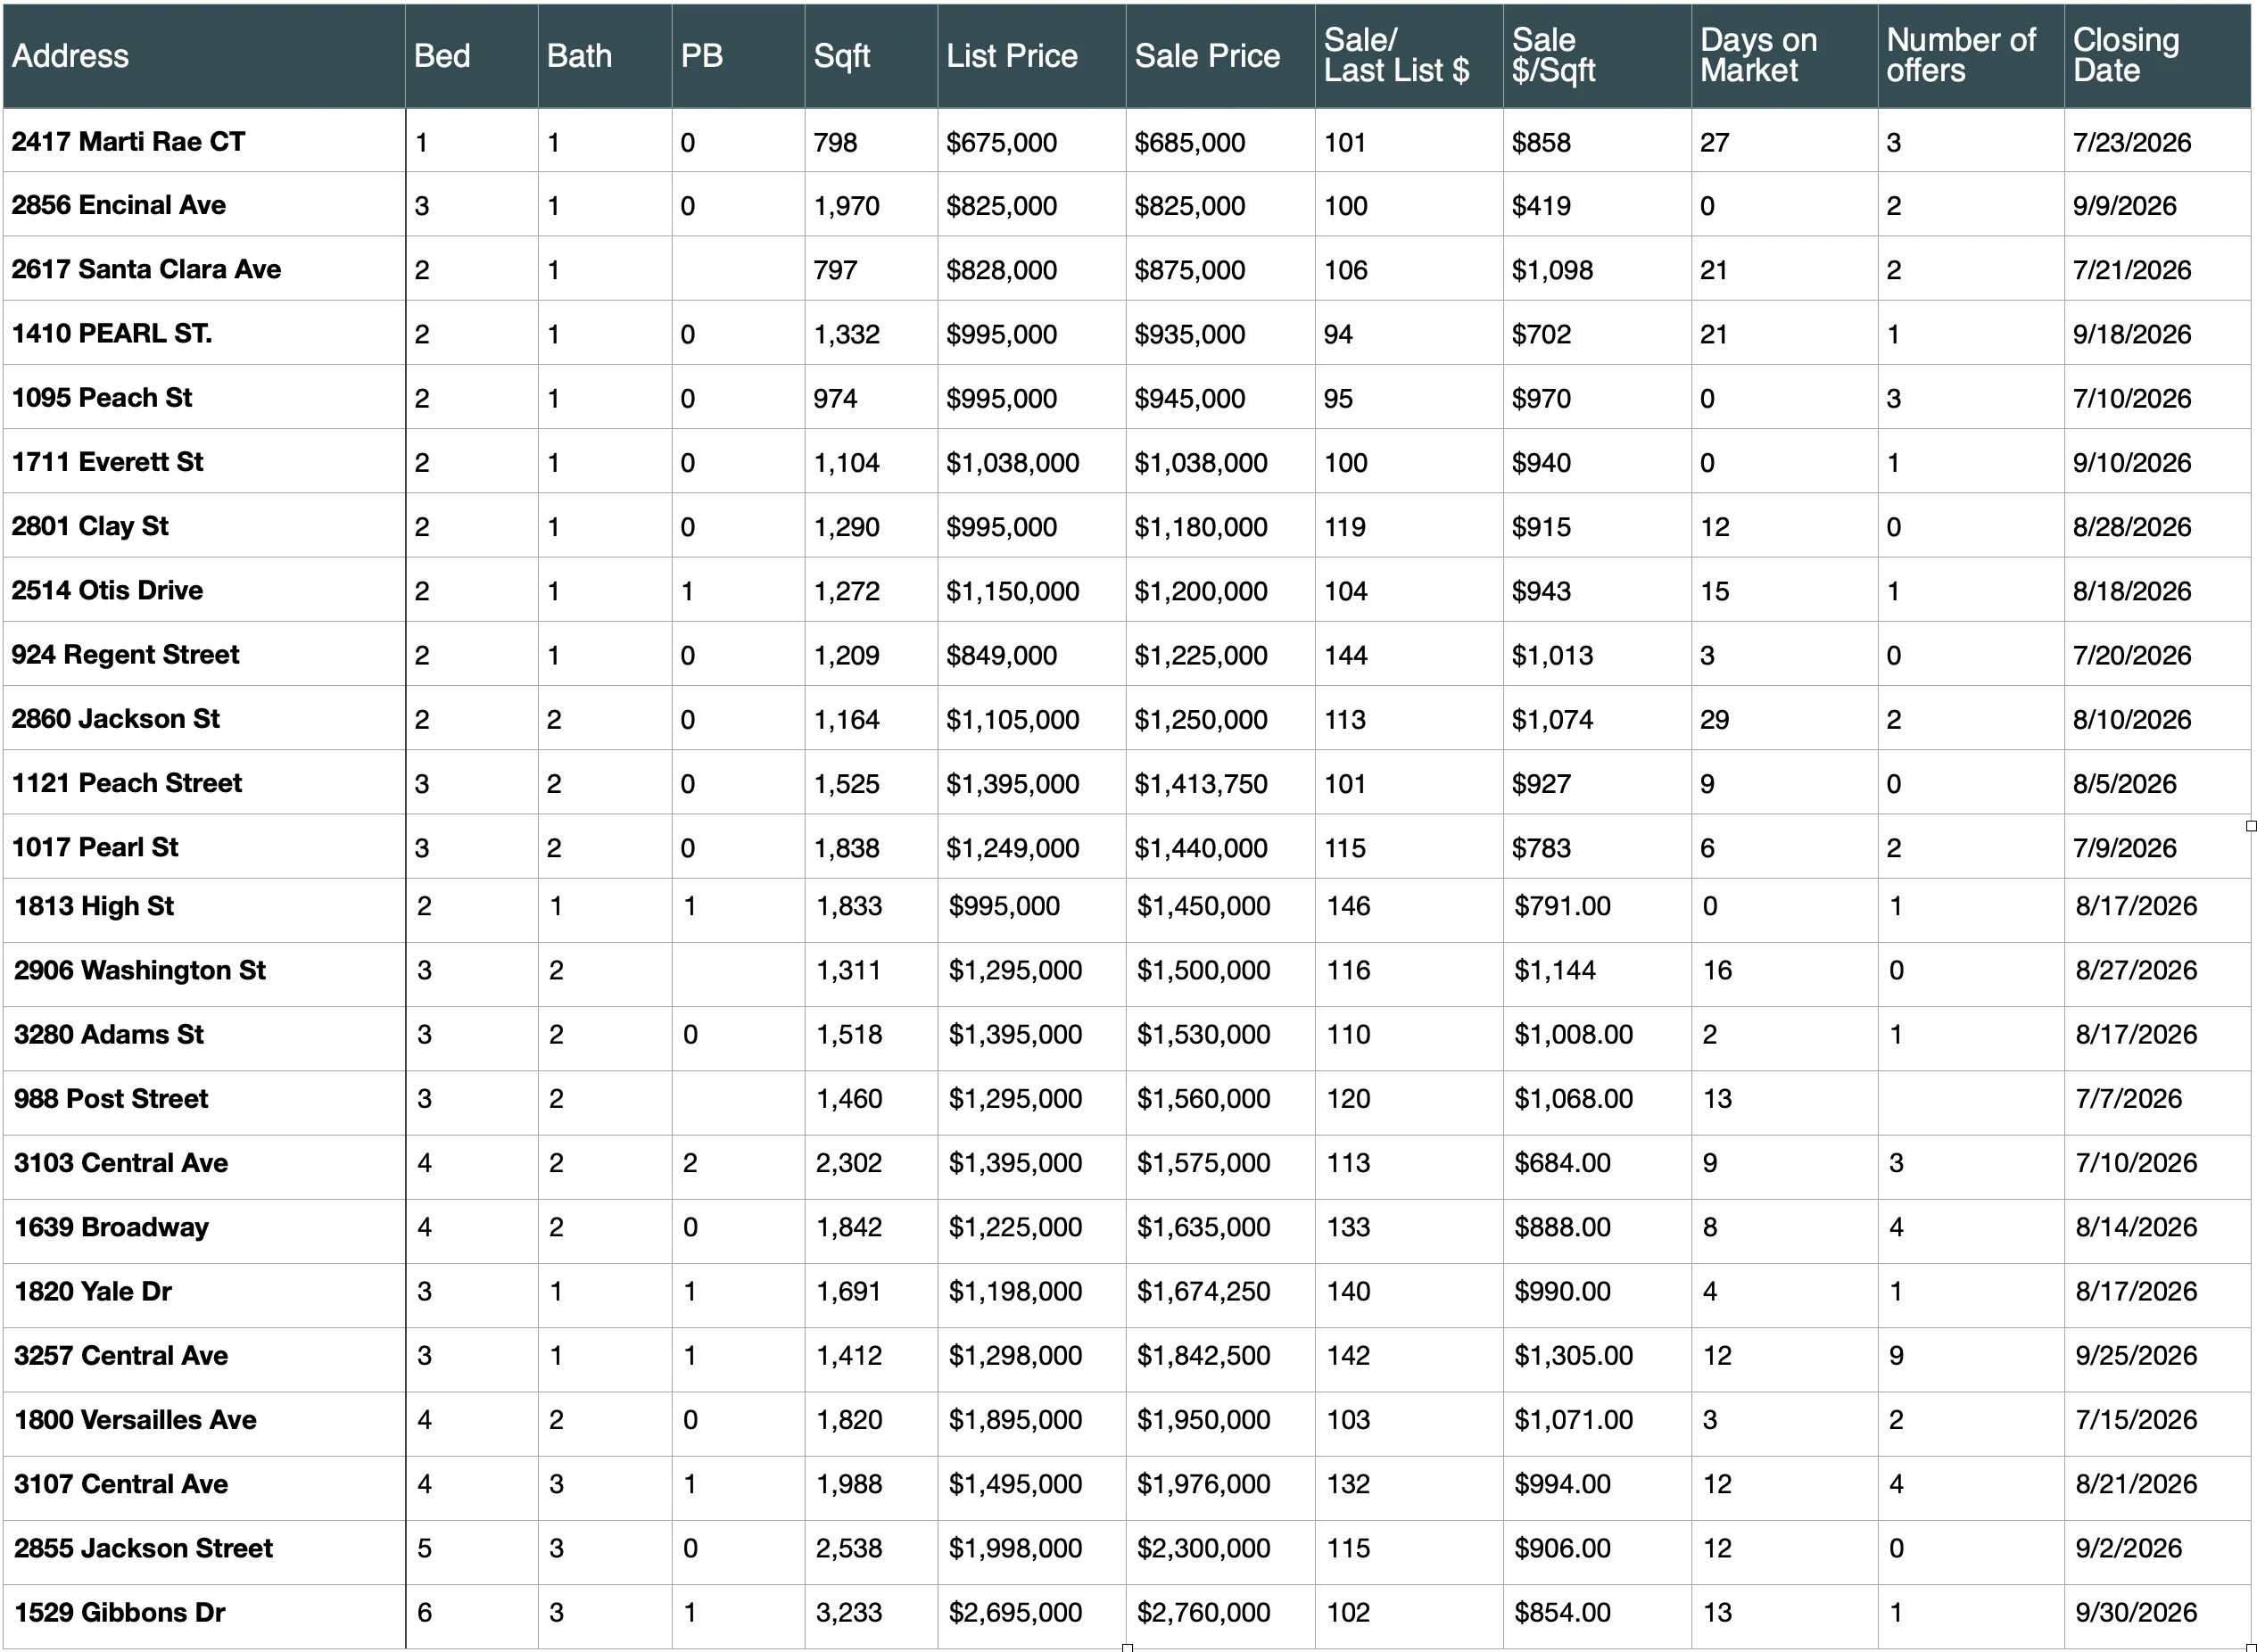
East End homes sold for an average of 15% over asking in Q3, reaching $931 per square foot. While the average sale price eased from last quarter, Q2’s record-breaking $3.6 million sale had lifted that average.
Four homes sold off-market this quarter, while buyer agents report continued demand for larger East End homes that remain in short supply.
For homeowners considering a move, understanding both buyer demand and opportunities beyond the public market can be an important advantage.
Gold Coast
The Gold Coast made Alameda real estate history in Q3, with the city’s highest-ever sale and KMG’s sale at 1235 Hawthorne, the third-highest sale ever in Alameda, closing just blocks apart.
Across nine sales, homes averaged $2.73 million and $850 per square foot, selling for 8% over asking.
As Alameda’s premier neighborhood for high-value homes, the Gold Coast continues to attract buyers willing to pay for exceptional properties.
Bronze Coast
The Bronze Coast had a quiet Q3, with just two homes sold at an average of $1.21 million.
Those sales averaged 1.5% over asking and $679 per square foot, with two offers per property.
With so few transactions, the numbers offer only a limited picture of current market conditions, making property-specific pricing and buyer demand especially important when evaluating a home’s potential.

SOUTH SHORE
South Shore saw just three single-family home sales in Q3, but competition was fierce for the right properties.
Two homes attracted 12 and 13 offers, helping drive the neighborhood’s average sale price to $1.83 million and sales to an average of 24% over asking.
With such a small number of transactions, results varied by property, reinforcing how much pricing, presentation, and buyer appeal can influence the outcome.

West End
West End vintage single-family homes sold for an average of $1.13 million in Q3, closing at 18% over asking and $911 per square foot.
Homes averaged 23 days on market, though individual results varied by property.
KMG represented the sellers in one successful off-market sale, highlighting that opportunities in this neighborhood aren’t always limited to homes listed on the MLS.
West End single-family homes overall sold for an average of $1.19 million in Q3, closing at 16% over asking and $864 per square foot (with only one newer build and 5 vintage homes in total).
With only six sales this quarter, results varied significantly by property, reinforcing the importance of understanding each home’s unique position in the market.

Harbor Bay / Bay Farm
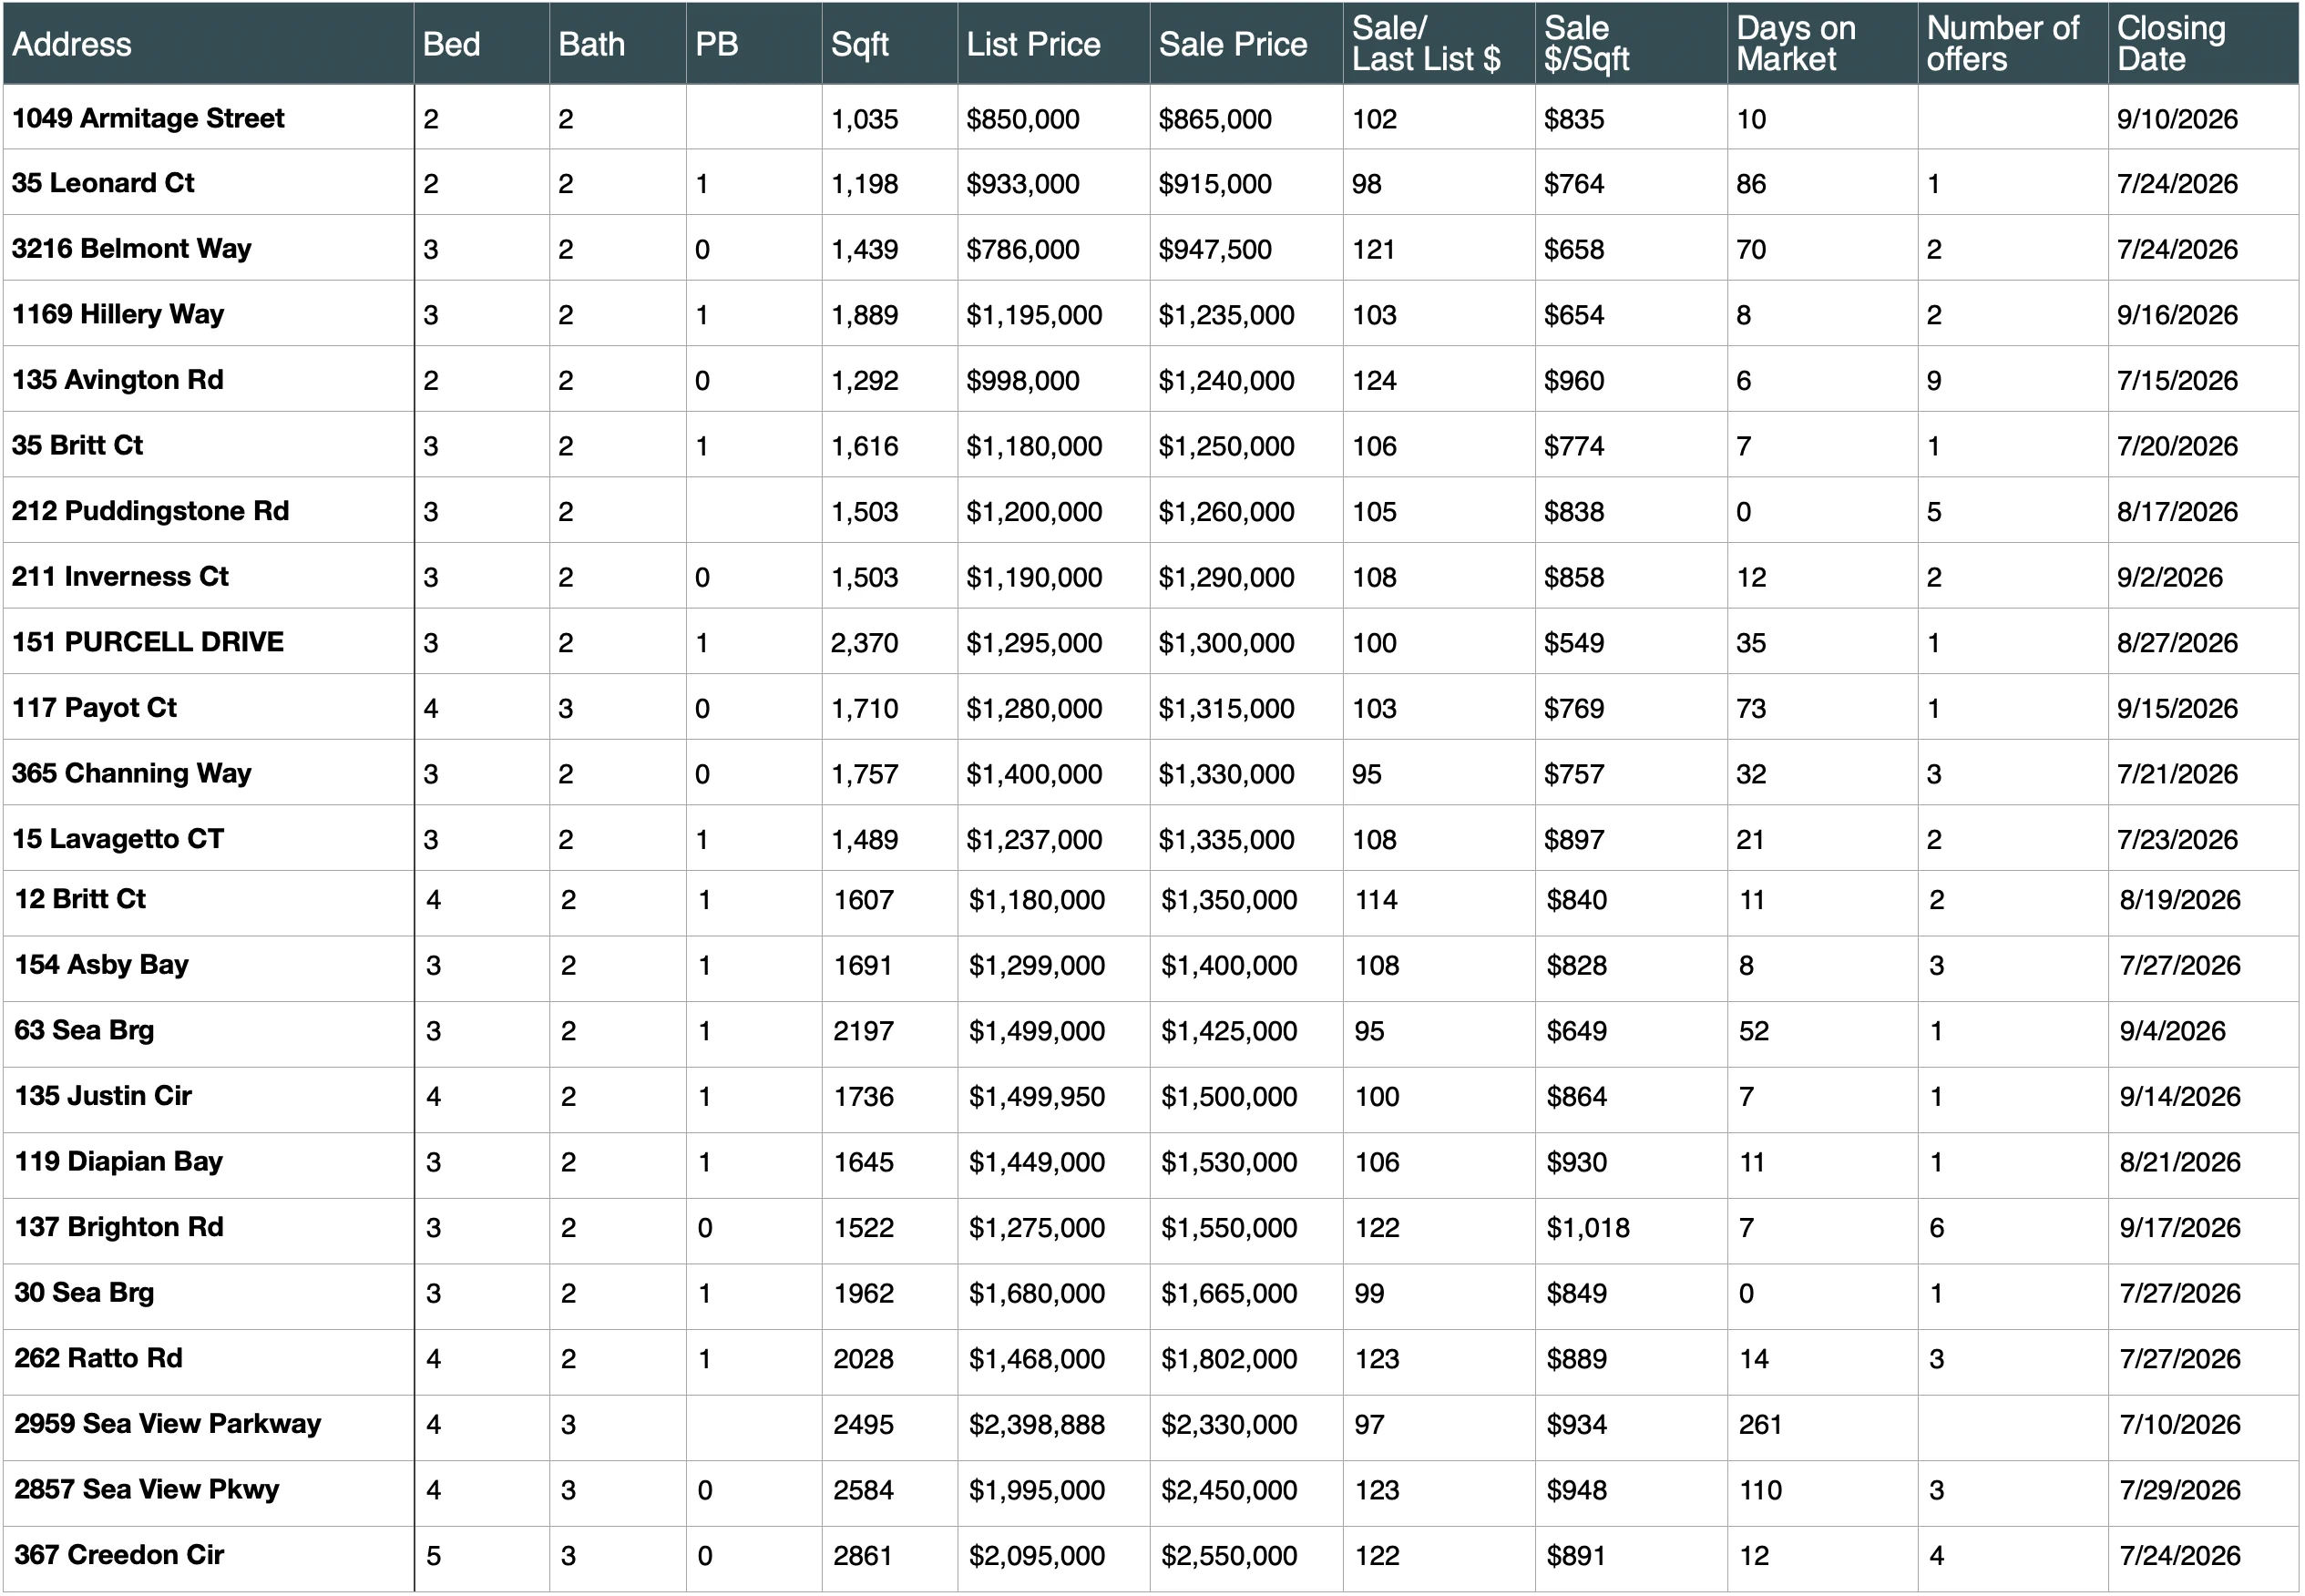
Harbor Bay’s Q3 market moved quickly for many sellers, with 14 of 23 detached homes selling within two weeks.
Homes averaged $1.47 million and $824 per square foot, closing 8% over asking.
But the timeline didn’t tell the whole story. KMG represented the sellers in both of the quarter’s highest-priced sales. One went pending in just 12 days, while the other spent 110 days on the market before becoming the second-highest sale.
The lesson? A home’s time on market doesn’t define its final value.
Central Alameda
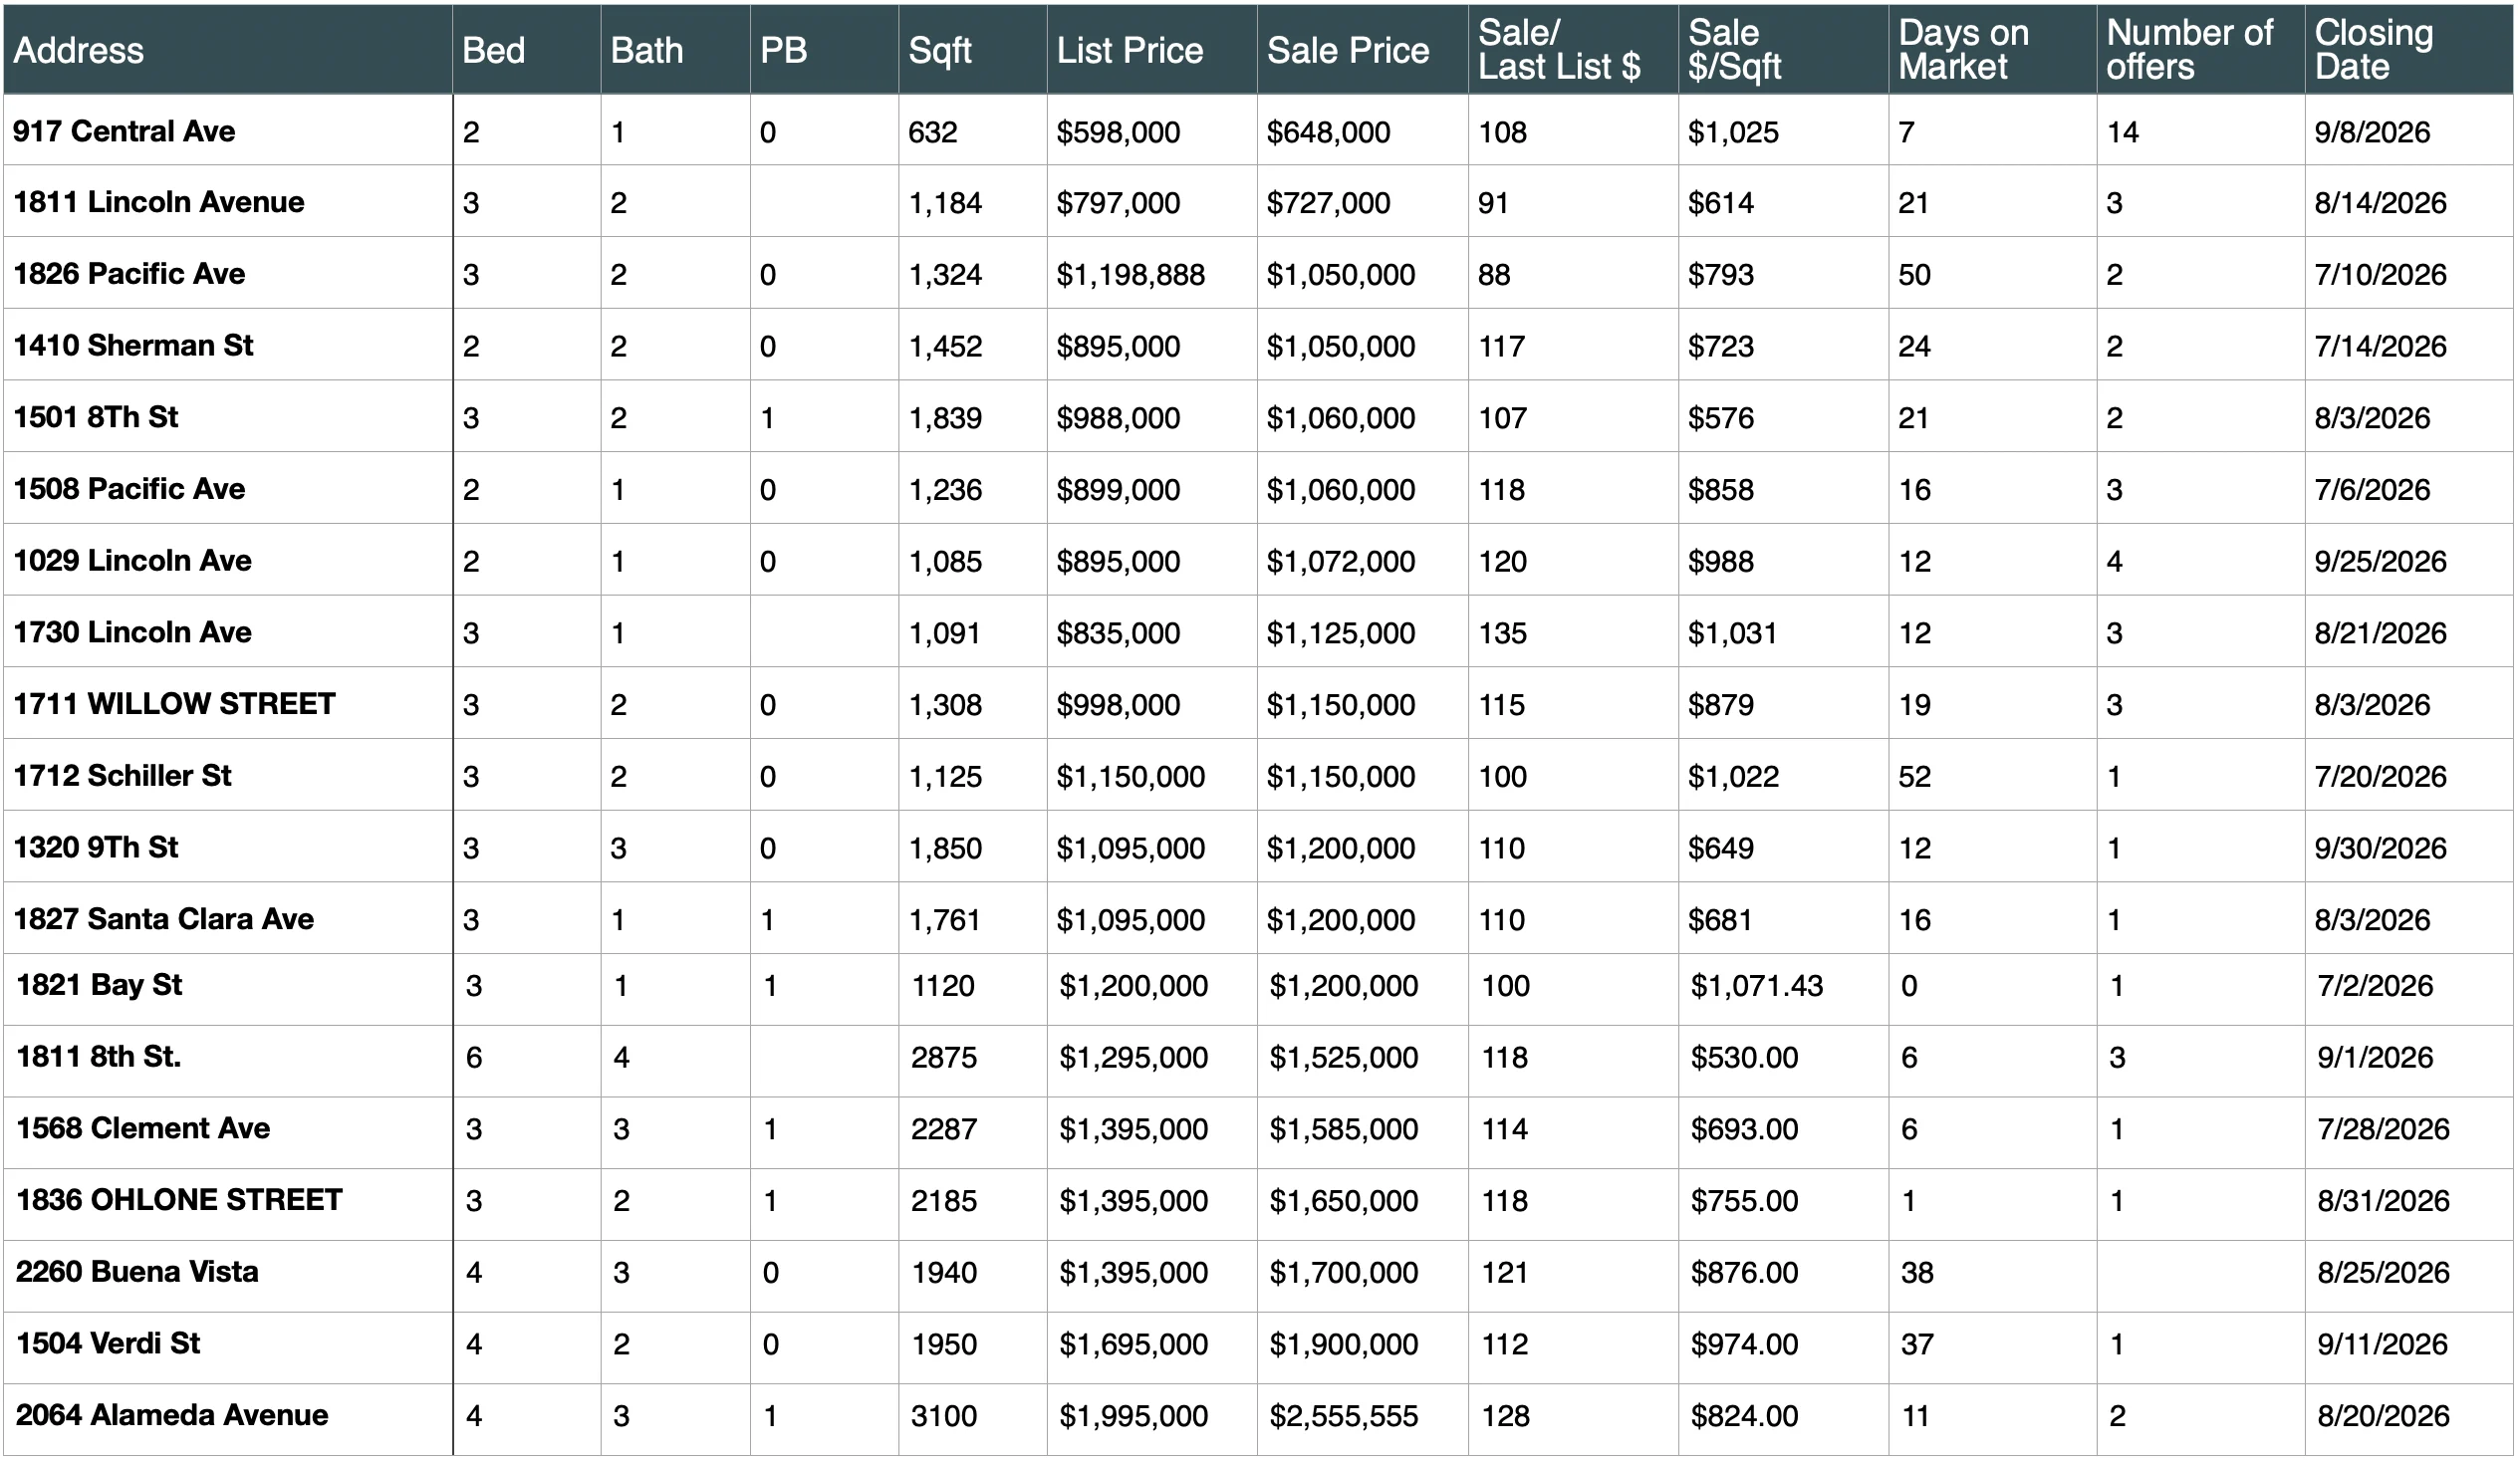
Central Alameda’s detached-home market remained competitive in Q3, with 19 sales averaging $1.30 million and $819 per square foot.
Homes sold for an average of 12% over asking, attracting 2.7 offers and spending 19 days on the market.
These results point to continued buyer competition, but averages only tell part of the story. Pricing, presentation, and how a home compares with competing listings all influence the outcome.
Looking Ahead
As we enter the last quarter of 2026, there are opportunities for both buyers and sellers, but they may require a little creativity and a willingness to look beyond the obvious.
Whether you’re planning a move, curious about your home’s value, or simply keeping an eye on the Alameda market, I hope these reports help you feel more informed and empowered.
And remember, when you’re ready to explore your options, we’re always here to help you understand not just what the numbers say, but what they actually mean for you.
Warmly,
Kate McCaffrey
Kate McCaffrey Group | Compass
Alameda’s #1 Real Estate Team